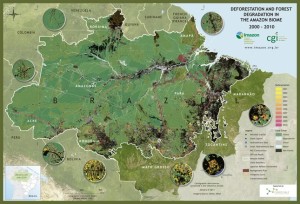
 Details of the methodology, the mapping results and the next steps in this Imazon monitoring project.
The Deforestation and Forest Degradation in the Amazon Biome map was produced by Imazon in order to contribute towards monitoring in the region.
The methodology applied simultaneously generates mapping of deforestation and forest degradation [caused by logging activity and forest burning] using Landsat satellite images. Existing methods individually detect and map those processes, which can lead to overlaps in the results and increasing uncertainty in estimates of annual deforestation rates. That happens because in the most intense Landsat images forest degradation can be confused with deforestation. Deforestation is a process for converting forest to other land uses, such as pastures, agricultural areas, mining, or even for urbanization. To do that it is necessary to completely remove the original forest cover, while forest degradation partially and temporarily removes that cover. For example, timber harvesting involves the removal of a certain number of trees (3 to 5) per hectare and opening of roads and logging decks for storing timber; forest fires open clearings through burning trees, while other trees receive lower impacts. Those processes lead to the reduction of the original forest carbon stocks and of biodiversity.
The methodology presented in this study makes it possible to map deforestation and forest degradation simultaneously, reducing possible zones of “confusion” in mapping those two types of processes. Another important contribution is the capacity for mapping deforestation in up to one hectare.
We used Landsat images acquired during the period of 2000 to 2010, which annually cover most of the Amazon Biome, in order to produce the first results of this new monitoring system at Imazon. The data [from satellite images] are normalized in space and time and quantitatively analyzed, which makes it possible to establish automatic, generic and consistent classification rules. We also applied computing rules to detect possible classification inconsistencies over time and correct those problems. Finally, the maps generated with automatic classification are inspected and edited by analysts in order to correct eventual errors. Those mapping results are later used to estimate the annual rate for deforestation and degradation through mathematical methods, for the referenced date of August 1 [used officially by the Brazilian government for that purpose].
The sections below present details of the methodology, the mapping results and the next steps in this Imazon monitoring project.
Download
View the online version.
